Student Loan Debt Statistics 2026
This article breaks down the Student Loan Debt Statistics of 2020 at a granular level and details about the how the loan is distributed among the various
Updated by Rakshitha N on 24th April 2026
Student Loan Debt Statistics 2026: Updated Q1 2026 Data
The 2026 student loan landscape reflects post-SAVE forbearance reality. Here are the most current statistics:
- Total U.S. student loan debt (Q1 2026): $1.78 trillion
- Federal portion: $1.65 trillion (93%)
- Private portion: $130 billion (7%)
- Total borrowers: 43.7 million
- Average debt at graduation (2024 cohort): $29,100 (public 4-yr) / $33,750 (private 4-yr)
- Graduate degree holders avg debt: $76,620
- Borrowers in default: 5.2 million (12% of borrowers)
- Borrowers in IDR plans (post-SAVE migration): 12.1 million
- Average payment when not on IDR: $503/month
- Generation Z share of new borrowers: 56%
- Female borrowers as % of total: 58% (women hold 2/3 of all student loan debt)
Sources: U.S. Department of Education, Federal Reserve Bank of New York Q1 2026 Household Debt and Credit Report.
Obtaining a college degree has now become more expensive than ever. Where it has appraised three times faster than the other school related finances. To overcome the financial crisis, most students are borrowing student loans to manage their tuition with positive thinking that their investment will pay off by getting a high paying job. Hence, Student debts have surpassed all the other forms of loans such as credit debts and auto loan debts.
According to the Department of education, U.S. borrowers carry a total of $1.53 trillion on student loans with an average federal debts of $35,397 and the average repayment term of 19.7 years.
Also, the number of total federal and private student debts lent goes beyond 1.6 million.
Here is a complete guide detailing the current student loan statistics in 2020 which also forecasts the future numbers and trends.
Table of content
- Average student loan statistics
- Federal student loan statistics
- Public service loan forgiveness statistics
- Private Student Debt Statistics
- Student loan statistics by states
- Student loan statistics by age
- Student loan statistics by professional degree
- Other important loan statistic of 2020
- Conclusion
Average student loan statistics
The current statistics measure that the student debts has become the second highest consumer debt category among all the available. Before applying for a college or borrowing a degree make sure you jot down these numerical figures regarding the student loans.
|
|
Borrowers |
Total loan borrowed |
Average loan |
|
Federal loans |
45 million |
$1.531 trillion |
$35,397 |
|
Private loans |
3.8 million |
$124.65 billion |
$32,300 |
On the whole, 70% of the students graduate with an outstanding loan. They own an average debt of $29,900 and the total monthly payment to be made is about $393.
Also studying at a detailed level, we can derive other facts such as,
-
14% of parents have an average of $37,200 in federal parent PLUS loans
-
$45.2 billion of loans are in a grace period
-
$128.4 billion are in deferment
-
$122.9 billion of loans are in forbearance
-
$685 billion of student loans under repayment
-
$45.2 billion of loans are in a grace period
-
11.2% on Student loan delinquency rate
Federal student loan statistics
Federal student loans are one of the convenient forms of a loan that a student can borrow where you get a chance to qualify for several federal programs during the repayment phase. Going forward, let's see the statistics of various types of federal student loans.
Federal student loan statistics by loan type:
With a number of student loans available, how do we choose the right student loan ? The best student loans are those loans that cover the costs to be incurred but also are manageable. It is advised to first explore your federal student loan options.
Students can opt to borrow any of these before choosing a private loan. The numbers chosen are quite high and the figures are shown below.
|
Type of federal loan |
Loan borrowed($ in billion) |
Borrowers (in million) |
|
Subsidized |
$280.7 |
29.5 |
|
Unsubsidized |
$516 |
28.9 |
|
Combined loan |
$796.7 |
33.2 |
|
Grad PLUS |
$75.2 |
1.4 |
|
Parent PLUS |
$96.1 |
3.6 |
|
Perkins |
$6.1 |
2.0 |
|
Consolidation loan |
$536.1 |
11.7 |
(source: studentaid.gov)
Federal student loan statistics by loan program:
With various federal programs to qualify for a student loan, the numerical figures qualified for the loan types are listed below,
|
Loan programs |
Student loans |
Borrowers( in million) |
|
Direct loans |
$1.24 trillion |
35.1 |
|
FEEL loans |
$261.6 billion |
12.1 |
|
Perkins loans |
$6.1 billion |
2.0 |
|
Total federal loan |
$1.53 trillion |
42.9 |
(source: studentaid.gov)
Student Loan Debt Statistics By Repayment Plan For Direct Loans:
Choosing the right Student Loan Repayment plan gives you the right authority over your money and control over the payment phase. Hence also leading to better money management.
|
Repayment plan |
Amount ($ in billions) |
Borrowers |
|
Level Repayment Plan (<10 years) |
$200.7 billion |
10.76 million |
|
Level Repayment Plan (>10 years) |
$77.6 billion |
1.70 million |
|
Graduated repayment plan (<10 years) |
$90.4 billion |
3.12 million |
|
Graduated repayment plan (>10 years) |
$16.7 billion |
340,000 |
|
Income-Contingent Repayment(ICR) |
$33.6 billion |
710,000 |
|
Income-Based Repayment(IBR) |
$170.4 billion |
2.77 million |
|
Pay as you earn(PAYE) |
$96.7 billion |
1.39 million |
|
Revised Pay As You earn(REPAYE) |
$168.9 billion |
2.9 million |
|
Alternative |
$44.9 billion |
1.29 million |
(source: studentaid.gov)
Student loan debts statistics by servicers:
Connecting with your loan servicers help you choose the right way to repay your loans as well as makes your repayment phase easier. To track your loan status frequently and manage your money well you need to work closely with your loan servicer.
The best student loan servicer is one who can help provide clarity to the borrower and keep him well informed throughout the repayment journey. Keeping that in mind, lets learn about the 2020 statistics regarding this concept.
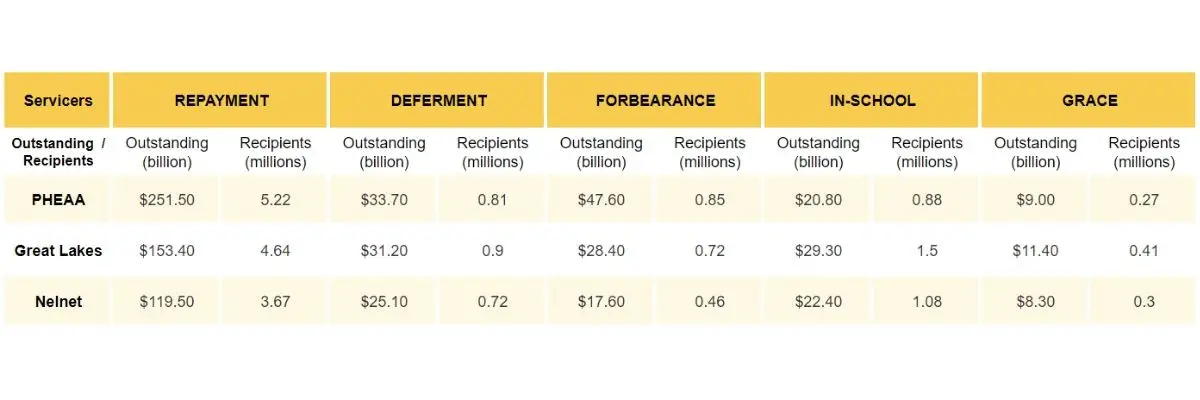
(source: studentaid.gov)
If you are currently on a Federal student loan and thinking about the ways to repay student loan easily, you could make important financial decisions such as Student loan consolidation where you combine all your loans into to repay over a lengthened period, standard loan repayment where you could enroll to various plans a repay according to your financial conditions.
Public Service Loan Forgiveness Statistics
You can qualify for a student loan forgiveness program with federal student loans while you work to serve the public or at government and non-private organizations. The various loan forgiveness federal programs are,
-
Teacher Loan Forgiveness
-
Loans after repaying under an income-driven repayment plan
-
Public service loan forgiveness
-
Total or permanent disability
Let's take a look at the loan statistics regarding the PSLF,
|
Number of applicants for PSLF |
161,328 |
|
PSLF borrowers |
1,132,007 |
|
Borrowers who submitted the PSLF |
126,817 |
|
Application that completed the processing |
151,337 |
|
PSLF applications approved |
2,246 |
|
PSLF applications rejected |
149,091 |
|
Borrowers who had loans discharged |
1,565 |
|
Total balance discharged through PSLF |
$99,184,903 |
(Source: U.S. Department of Education)
Private Student Debt Statistics
As per the statistics, in 2020 the total amount of private student debt the borrowers must owe is about $124.65 billion but it is lesser compared to the federal loans. On the whole, there are 88.3% of undergraduates and 11.69% of graduate students who have a private loan at the moment.
Overall private student loans as of September 2019 total $66.16 billion. Other facts about the debts are,
|
Loan status |
Private student loan (%) |
|
Repayment |
73.44% |
|
Grace period |
6.00% |
|
Deferment |
18.34% |
|
Forbearance |
2.22% |
|
Interest rates |
14.24% |
Students can contact their Private Student Loans to get attractive options to eliminate loans sooner such as enrolling in autopay to get an interest reduction, making extra payments, or even consider refinancing student loans, that is to combine all the loans and make affordable payments.
Student loan statistics by states
With highly populated states in the United States, California, Florida, Texas, and New York top the list of highest student loans borrowed with a total of $420 billion.
According to december 31,2019, Maryland was the biggest debt holder with an average of $41,460 and North Dakota with the lower average debt of $27,677.
|
State rank |
Average loan balance ($ in million) |
Borrowers with more than 100,000 (%) |
|
1.Maryland |
$41,460 |
10.3 |
|
2.Georgia |
$40.526 |
9.4 |
|
3.Virginia |
$37,928 |
8.2 |
|
4.New York |
$36,667 |
8.1 |
|
5. Illinois |
$36,510 |
8.0 |
|
6.Mississippi |
$35,621 |
8.0 |
|
7.Florida |
$37,230 |
7.9 |
|
8.Delaware |
$36,134 |
7.9 |
|
9.California |
$35,395 |
7.8 |
|
10.Vermont |
$36,096 |
7.7 |
(Source: U.S. Department of Education)
Student loan statistics by age
As a part of the statistics, we must consider age as an important factor which determines the age group which holds highest loans. Assuming that a student borrowed a loan in 2005, the repayment phase comes to an end in 2024 as it is determined that the average repayment phase is 19.7 years. Now lets breakdown and see the student loan borrowers by age,
|
Age |
Student loan borrowers ( in million) |
Amount borrowed ($ in billion) |
|
< Age 24 |
8.2 |
$121.2 |
|
25 - 34 |
15.0 |
$501.5 |
|
35 - 49 |
14.1 |
$575.5 |
|
50 - 61 |
6.0 |
$241.2 |
|
> 62 |
2.1 |
$75.9 |
(Source: U.S. Department of Education)
Student loan statistics by professional degree
It is recorded that about 40% of the 1.53 trillion student loans has been consumed by the graduates and professional degree students to support themselves for education. Taking the undergraduate and graduate program into consideration, we can closely determine how much loan was borrowed by the students pursuing the professional categories.
|
Category |
Loan borrowed |
Graduate degrees (in %) |
|
Master of Science |
$50,400 |
18 |
|
Master of Education |
$50,879 |
16 |
|
MBA |
$42,000 |
11 |
|
Master of Arts |
$58,539 |
8 |
|
Medicine and Health Sciences |
$161,772 |
5 |
|
Law |
$140,616 |
4 |
Other important loan statistic of 2020
In addition to all these statistics, there are other aspects which can be considered such as,
|
Colleges |
No. borrowers who graduated |
Average student debt |
|
Public colleges |
66% |
$25,550 |
|
Private Non-Profit Colleges |
75% |
$32,300 |
|
For-Profit Colleges |
88% |
$39,950 |
-
Other financial needs such as pell grants are offered to students. However 88% of the students who receive pell grants borrowed a student loan with an average balance of $31,200 per borrower.
-
53% of students who didn't receive a pell grant have an average debt of $26,450 per borrower.
-
The student loan borrowed in the academic year of 2018-2019 was about $259 billion and in the present years the figures have increased exponentially to about 1.3 trillion.
-
69% of the students graduated from a four-year program in 2019had an outstanding student loan
-
48% of students with student loans default within 12 years after attending for-profit colleges compared to 12% of the public college and 4% of non-profit college students.
The interest rates on student loans are at the lower level for the academic year of 2020-2021. It is also the lowest rate compared to the past decades.
|
Loan type |
Interest rate of 2020-2021 (in %) |
|
Subsidized |
2.75 |
|
Unsubsidized |
4.3 |
|
Grad PLUS |
5.3 |
|
Parent PLUS |
5.3 |
Conclusion
From the statistics shown, we can conclude that the education expenses have raised sky high and attending college is a burden for most. Investing on your education is an investment you make on yourself. Make sure you're aware of the terms and understand the loan completely before borrowing one as you need to repay them in future. Also consider the other ways to pay off student loans quicker for both private and federal loans to eliminate the burden and become debt-free sooner.


93.jpg)


28.jpg)